


With respect to formulation of dialogue exchanges, state-of-the-art map systems support human input using direct manipulation, speech-only input, or keyboard and speech combined with touch or mouse pointing. For example, map interaction based on direct manipulation permits the user to formulate ``dynamic queries" by adjusting individual sliders for pre-selected types of information, such as Dynamic HomeFinder's ability to specify a desired real estate minimum and maximum price range by moving a slider to the desired multiple of some number [14].This approach provides a nonlinguistic form of question-answer interaction, rather than an extended interactive dialogue. Compared with linguistic modes of interaction (e.g., speech, pen, keyboard), direct manipulation queries are relatively inflexible in their coverage, and are unable to support spontaneous description. For example, a language-based map system permits users to automatically locate out-of-view entities through simple description of landmarks and streets (e.g., ``Where are the for-sale homes farthest from Yuba fault?").
Other systems such as Voyager and GeoSpace focus on spoken input as a means of conducting an information-seeking dialogue with a map [5,15], for purposes like navigational assistance, tourist information, or information about local municipalities and their services. This class of systems emphasizes extended spoken dialogue, and in some cases provides multimodal output via text, graphics, and synthetic speech. However, human input relies exclusively on a single modality, rather than combining speech with a means of selectively pointing at the map display. On the other hand, map systems such as Cubricon and Miltalk, a variant of Shoptalk, include multimodal input as well as output, with the user able to speak or use keyboard input combined with mouse pointing [4,6]. These latter systems integrate direct manipulation and language input, yielding a potentially complementary spoken and manual input blend [4]. However, for functions like pointing on dense maps, or tracing fine-grained roadway networks, both mouse pointing and touch are relatively imprecise. They also are insufficiently versatile for creating the full array of gestures, symbols, and graphic drawings that are needed in different map applications.
In contrast, interfaces for combined spoken and pen-based input may be particularly effective for interacting with dynamic map systems, although multimodal interfaces that recognize two or more naturally-integrated input streams are still by and large in the planning stages. Although research relevant to the design of multimodal systems that incorporate speech and pen input is beginning to emerge [11,12], the problem of how to optimize such interfaces for map displays has received little attention. In verbal and quantitative domains, interface design parameters clearly have a major impact on improving system robustness --- for example, by guiding human input to coincide more closely with system processing capabilities. Empirical work within these domains indicates that basic interface design can be used to reduce difficult sources of linguistic variability in human speech and writing by a factor of 2- to 8-fold [8,11]. More specifically, both input modality and presentation format have a documented influence on users' overall wordiness, utterance length, lexical variability, disfluencies, bigram perplexity, syntactic ambiguity (i.e., number of parses generated), and semantic integration. For instance, a highly structured form-based interface can successfully filter out difficult-to-process lexical content such as conjunctions, prepositions, and nonstandard abbreviations, can substantially lower perplexity and syntactic ambiguity scores, and can filter out 70% of the spontaneous disfluencies otherwise observed when the same person accomplishes the same task using an unconstrained interface [11,8].
Apart from being difficult for recognition systems to process, spontaneous disfluencies present a particularly interesting source of linguistic variability because of their relation to sentential planning demands. During human-computer interaction in verbal and quantitative domains, it has been confirmed that disfluencies are elevated when an interface format is unconstrained, such that the user must take more initiative to self-structure the content and order of information presented to the system [8]. It also has been demonstrated that increased utterance length is a powerful predictor of spoken disfluencies during human-computer interaction, with a linear predictive model best summarizing this relation [8]. However, further research is needed on the source of planning load in complex visual domains, so that interfaces can be developed that effectively manage disfluencies and other difficult sources of input variability.
As a class of emerging systems, dynamic interactive maps have received little empirical guidance with respect to interface design. One aim of the present research was to explore interface issues relevant to the design of map-based systems, including assessment of human performance in terms of efficiency, accuracy, cognitive load, and preferential use. Another aim was to investigate performance in map tasks representing a range of different functions involved in seeking and filtering information from a map database, creation and editing of new map content, and control of the map display.
In this study, human performance was examined during spoken and pen-based input to dynamically interactive maps. Data were collected while people spoke, wrote, or combined speech and writing as they completed realistic tasks with a simulated map-based system. Communication modality (speech, writing, multimodal) and map display format (highly versus minimally structured) were varied in a within-subject factorial design. Consistent with previous research, it was predicted that people would prefer to interact multimodally rather than unimodally [12]. From a performance standpoint, the issue of whether unimodal or multimodal interactions would yield greater advantages in the map domain also was explored. It was hypothesized that users' preference for multimodal map interaction might be congruent with performance advantages in this modality --- including faster completion time and fewer performance errors than during unimodal interaction. Cognitive load associated with the need to articulate spatial location descriptions was explored as a possible source of performance difficulty during speech-only interaction with maps.
In comparison with previously explored verbal and quantitative domains, the base-rate of disfluencies was predicted to be higher during interaction with map displays, in part due to a need to articulate abstract visual-spatial information pertaining to location, size, and shape. If elevated, this higher disfluency rate would represent a special difficulty requiring interface management in map domains. Based on previous research, it also was hypothesized that a highly-structured map display that effectively reduces users' need to self-structure their input would reduce both spoken disfluencies and performance errors. Finally, the rate of disfluencies was examined in sentences of varying length, to assess whether longer utterances in the map domain have an elevated rate of disfluencies per 100 words compared with briefer ones. Implications of this research are discussed for the design of future high-performance dynamic maps.
During the study, subjects received a general orientation to the Service Transaction System, and on how to enter information on the LCD tablet when writing, speaking, and combining both modalities. When writing, they were free to use cursive handwriting or printing, gestures, symbols, graphics, pointing, or other marks. They were told to write information with the electronic stylus directly onto the color map displayed on their LCD tablet. When speaking, subjects were instructed to tap and hold the stylus on the map as they spoke. During free choice, people were completely free to use either modality in any way they wished. In all cases, they were encouraged to speak and write naturally, to work at their own pace, and simply to focus on completing their task.

Figure 1: Minimally structured map display format during real estate selection
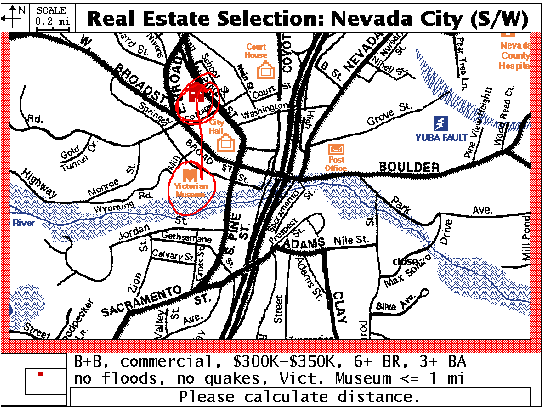
Figure 2: Highly structured map display format during real estate selection
People also were instructed on completing tasks using two different presentation formats. In one format illustrated in Figure 2, a detailed reference map displayed the full network of roadways, buildings, overlay information, and labels that are conventionally found on hard-copy reference maps. This format presented the most graphically and linguistically structured map. The second format, illustrated in Figure 1, displayed only a streamlined network of roads leading to available real estate, and only buildings and overlay information to which the user actually referred. Essentially, the default structure in this format was a less structured ``minimalist" version of the reference map, with about one-third of the roadway and overlay information as the more structured display. However, people were free to add more information to this map format as they worked.
Other than specifying the available input modality and map format, an effort was made not to influence the manner in which people expressed themselves. People's input was received by an informed assistant, who performed the role of interpreting and responding as a fully functional system would. Essentially, the assistant tracked the subject's written or spoken input, and clicked on predefined fields at a Sun SPARCstation to send altered map displays and confirmations back to the subject. After the session, a post-experimental interview was conducted and subjects were debriefed.
Semi-Automatic Simulation Technique. In developing this simulation, an emphasis was placed on providing automated support for streamlining the simulation to the extent needed to create facile, subject-paced interactions with clear feedback, and to have comparable specifications for the different input modalities. In the present simulation environment, response delays averaged less than 1 second between subject input and system feedback. The simulation was designed to be sufficiently automated so that the assistant could concentrate attention on monitoring the accuracy of incoming information, and on maintaining sufficient vigilance to ensure prompt responding. Technical details of the general simulation method have been provided elsewhere [10]. However, the specific method used in this study was adapted extensively to handle the dynamic display and manipulation of maps, overlays, and photographs.
Research Design and Data Capture. The research design was a completely crossed factorial with repeated measures, with the following main factors: 1) communication modality -- speech-only, pen-only, multimodal pen/voice, and 2) presentation format -- highly structured map, minimally structured map. All 18 subjects completed two subtasks within each of these six conditions, with the order of conditions counterbalanced across subjects. In total, data were available from 216 tasks for analysis purposes. All human-computer interactions were videotaped. Hardcopy transcripts also were created, with the subject's handwritten input on the map captured automatically in context, and spoken input transcribed onto the printouts.
Transcript Coding. Coding was conducted for the following measures:
Total Words and Mean Length of Utterance (MLU)-- The total number of spoken and written words, as well as the average number of words per utterance, was tabulated for each condition and subject.
Disfluencies and Self-Corrections-- Spontaneously occurring disfluencies and self-corrections were totaled for each subject and condition. The total number of disfluencies per condition then was converted to a rate per 100 words, and average disfluency rates were summarized as a function of condition and utterance length. Disfluencies of the following types were coded: (1) Content self-corrections-- e.g., ``west of, no, east of Seven Hills School,'' (2) False starts-- e.g., ``I want to be...have the hospital within 1.5 miles," (3) Verbatim repetitions-- e.g., ``Victor...Victorian museum," (4) Spoken filled pauses-- e.g., ``uh,'' ``um,'' (5) Written self-corrected spellings and abbreviations-- e.g., "sroll...scroll;" ``BA...bath.'' Details of disfluency definitions and classification have been provided elsewhere [8].
Spatial Location Descriptions-- The total number of sentences containing a spatial location description were tabulated, as was the mean length of these utterances. Expressions scored as spatial location descriptions were those specifying an object's placement in relation to other objects, landmarks, or roads on the map. Typical location descriptions included simple locative prepositions (e.g., ``Close Willow Road between the post office and May Lake"), approximate location descriptions (e.g., "Move the overpass a little farther to the right"), the relative orientation and/or distance between objects (e.g.,``The apple orchard is 0.2 miles east of Sugarloaf Mountain Park"). To evaluate whether sentential content involving location descriptions is more prone to disfluency than other content, all sentences containing spatial location descriptions were scored for the rate of spoken disfluencies within constituent clauses representing the location description versus the rest of the sentence.
Task Completion Time-- The number of seconds required to complete each subtask was totaled for each condition and subject.
Task-critical Content Errors-- The total number of task-critical content errors was tabulated for each condition and subject. An example of such an error would be requesting a home with the wrong number of bedrooms for a client, or placing a new building at the wrong intersection.
Self-reported and Observed Preferences-- During post-experimental interviews, people's self-reported preference was assessed for communicating in either combined pen/voice, unimodal speech, or unimodal writing. In addition, preference to complete tasks using the more structured reference map versus minimalist map was assessed. When subjects were free to use any input mode in the multimodal conditions, their observed preference to interact multimodally versus unimodally also was tabulated.
Reliability. All dependent measures reported in this paper had reliabilities of 0.80 or above, and 90% of the measures had reliabilities above 0.86.
Disfluencies and Self-Corrections. The data yielded a corpus totaling over 12,000 words, including approximately 250 disfluencies for analysis. Since it was predicted that the disfluency rate would be more elevated in a complex visual domain than in verbal or quantitative domains reported previously [8], the average total disfluency rate was compared for verbal and map-based simulations. It was confirmed that the disfluency rate was significantly more elevated in the map domain than the verbal one, t (34) = 3.39, p < .001, one-tailed.
Table 1 summarizes the average spoken disfluency rates for six types of human-computer interaction, comparing human-computer map-based disfluencies with other kinds of spoken interaction reported previously [7,8]. These disfluency rates all are lower than those reported for human-human spoken interactions which, for example, have been estimated at 5.50 disfluencies per 100 words for two-person face-to-face interaction involving verbal content [8] and 7.34 for two-person interaction involving map-based tasks [2].
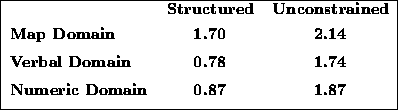
Table 1: Spoken
disfluency rate per 100 words for human-computer
interaction involving different formats and content domains
As predicted, disfluencies in the multimodal conditions were significantly lower than those in the speech-only conditions, with average rates of 1.25 and 1.95, respectively, paired t (17) = 2.36, p < .02, one-tailed. With respect to format, the average rate of all spoken and written disfluencies also was significantly elevated in the minimally structured map compared to the highly structured one, with an average of 2.26 versus 1.68 disfluencies per 100 words, respectively, paired t (15) = 1.76, p < .05, one-tailed. This format effect also is illustrated in Table 1.
Since previous simulation studies in the verbal and numeric domains have demonstrated a strong relation between spoken utterance length and the likelihood of a disfluency, disfluency rates in the map domain were examined further for specific utterances graduated in length. Analyses indicated that the average rate of spoken disfluencies increased significantly with utterance length for lengths 2-21, r = +.89. When the rate of spoken disfluencies was compared for short (1-6 words), medium (7-12 words), and long utterances (13-21 words), it increased from 0.95, to 1.64, to 5.06 disfluencies per 100 words, respectively. Statistical comparisons confirmed that these rates represent a marginal increase between short and medium sentences, t = 1.73 (df = 10), p < .06 (one-tailed), and a significant increase between medium and long ones, t = 4.00 (df = 5.2, separate variances), p < .005 (one-tailed).
A regression analysis indicated that the strength of predictive association
between utterance length and spoken disfluency rate was  =
.79 (N = 17). That is, 79% of the variance in the rate of spoken
disfluencies was predictable simply by knowing an utterance's specific
length. The following linear model, illustrated in the scatterplot in
Figure 3, summarizes this relation:
=
.79 (N = 17). That is, 79% of the variance in the rate of spoken
disfluencies was predictable simply by knowing an utterance's specific
length. The following linear model, illustrated in the scatterplot in
Figure 3, summarizes this relation:  , with a Y-axis constant coefficient of -0.84, and an
X-axis beta coefficient of +0.35 representing utterance length. These data
indicate that the demands associated with planning and generating longer
constructions while interacting with a map lead to a substantial increase
in the rate of disfluent speech, which generalizes a similar finding
obtained in the verbal and numeric domains
[8].
, with a Y-axis constant coefficient of -0.84, and an
X-axis beta coefficient of +0.35 representing utterance length. These data
indicate that the demands associated with planning and generating longer
constructions while interacting with a map lead to a substantial increase
in the rate of disfluent speech, which generalizes a similar finding
obtained in the verbal and numeric domains
[8].
Since utterance length is strongly related with disfluency rates, and since the average utterance length varies between domains and input modalities, the present data

Figure 3: Linear regression model summarizing increasing rate of spoken
disfluencies per 100 words as a function of utterance length during map
interactions
were examined further to evaluate whether differences in utterance length alone could potentially account for the observed difference in disfluencies between: (1) verbal and map-based domains, or (2) speech-only and multimodal input conditions. To make this assessment, a comparison of disfluency rates was conducted for utterances matched on length. With utterance length controlled in this manner, the average spoken disfluency rate in the verbal versus map domains was 1.64 versus 1.70, with no significant difference as a function of domain content alone, paired t (10) < 1. Likewise, a comparison of disfluency rates in speech-only versus multimodal conditions, after matching samples on length, revealed averages of 1.86 and 1.99, respectively, paired t (16) < 1.
Spatial Location Descriptions. In light of the fact that utterance length may correlate with and simply be mediating other unique linguistic characteristics of speech to maps, spatial location descriptions were analyzed in terms of their relation to MLU and disfluencies. An average of 17.2 utterances per subject in the speech-only conditions contained adverbial locative descriptions, which was reduced significantly to 6.7 for the same subjects in the multimodal conditions, paired t(17) = 10.04, p < .001, one-tailed. Sentences containing location descriptions also were relatively lengthy, and they were significantly lengthier when spoken than when delivered multimodally (i.e., averaging 9.85 and 8.96 MLU, respectively), paired t test, t(15) = 1.89, p < .04, one-tailed. In contrast, the average MLU was just 6.22 for all spoken sentences, and 4.79 for all multimodal sentences in the map domain. Finally, sentences containing spatial location descriptions had an elevated rate of spoken disfluencies. Further analysis revealed that sentential constituents containing a location description averaged 2.51 spoken disfluencies per 100 words, which was significantly higher than 1.68 in the baseline constituent of the same sentences uttered by the same speaker, Wilcoxon Signed Ranks test, z = 1.66 (N = 16), p < .05, one-tailed. These findings confirm that longer and more disfluent utterances resulted when a spatial location description was produced while speaking to the map. Furthermore, the spatial location constituent of an utterance was significantly more disfluent than the baseline constituent of the same utterance.
Task Completion Time. Task completion times were significantly faster during multimodal map interactions (249 secs) than during either speech (278 secs) or writing (410 secs), paired t (17) = 1.92, p < .04 (one-tailed) and paired t (17) = 8.19, p < .001 (one-tailed), respectively. Figure 4 illustrates that this relative speed advantage of multimodal over speech-only input is unique to the visual/spatial map domain, and was not found in verbal or numeric domains.

Figure 4: Task completion time as a function of input modality and content
domain.
Task-critical Content Errors. Users averaged 0.54 content errors per task set overall, with the rate of errors during combined speech and writing just 0.39 per task set, compared with 0.67 for writing and 0.61 for speech. Wilcoxon signed ranks analysis confirmed that task-critical content errors were elevated significantly during speech-only interaction compared with multimodal input, T+ = 83 (N = 14), p < .03, one-tailed. However, analyses revealed neither a significant difference in content errors between speech-only and writing-only interactions, nor between writing-only and multimodal interactions.
An analysis of the predominant type of content errors revealed that approximately 48% involved locating objects incorrectly in relation to landmarks or streets on the map. One common source of these location errors involved reversals of orientation (e.g., ``The handicaped center is east, no, west of Deer Creek School"). Another common source accounting for 18% of all errors involved incorrectly specifying inclusion/exclusion relations with respect to a distance between two objects (e.g., ``I'd like a house within a mile of the airport...I mean, at least a mile away from any airports.")
Self-reported and Observed Preferences. Results indicated that 94.5% of subjects preferred interacting with the map multimodally, 5.5% preferred exclusively written input, but none of the participants preferred unimodal spoken input. Figure 5 (left panel) illustrates this strong preference for multimodal versus unimodal interaction within the map-based domain, in comparison with recently reported preferences to interact multimodally in verbal and quantitative domains [12]. Figure 5 (right panel) illustrates that users also were observed to select multimodal over unimodal input 100% of the time in the map domain when they had free choice. Both self-reported and observed preference to use multimodal input were most pronounced in the complex visual domain, compared with others reported previously. With respect to display format, 83.5% of participants preferred interacting with the more structured map, whereas 11% reported no preference, and 5.5% preferred the minimally structured display format.

Figure 5: Self-reported preference for
multimodal versus unimodal interaction in verbal, quantitative, and
map-based simulations (left panel), and users' observed
multimodal versus unimodal interaction during free choice (right panel)
In large part, the error-prone, slow, disfluent, and generally unacceptable nature of speech-only input to maps can be traced directly to people's difficulty articulating spatially-oriented descriptions. The following example illustrates one subject's difficulty articulating a location description: ``Add an open space on the north lake to b-- include the north lake part of the road and north." In contrast, the same task was achieved multimodally simply by circling an area and saying, ``Open space." Analysis of task-critical performance errors revealed that approximately 48% of all content errors involved locating objects incorrectly in relation to landmarks or streets on the map. Of these, the largest subclass of location errors was reversals of orientation (e.g., ``Close the road west, um, east of American Hill Park"). Another common subclass involved misspecification of containment or exclusion relations pertaining to a distance between two points (e.g., ``Show me houses within a mile, I mean at least a mile away from highway 49").
A systematic analysis of all map utterances containing location descriptions revealed that the same person accomplishing the same task generated 157% more such sentences when speaking than when mixing modes, and that these spoken constructions averaged longer than their multimodal counterparts. During multimodal interactions, people selectively used the pen to point or create graphics in a way that effectively specified location, shape, and area--- eliminating the need to articulate complex location descriptions. Further analysis of utterances containing location descriptions, in which baseline versus location constituents were compared, clarified that spoken disfluencies were concentrated 50% more heavily in location-descriptive constituents. That is, for utterances matched on both speaker and length, a significantly higher loading of spoken disfluencies was evident on sentential constituents describing location. Essentially, the need to speak spatial information can be viewed as a primary source of planning demand in map-based domains, and one that directly contributes to increased disfluent speech in this domain.
Spoken disfluencies during map interaction also were confirmed to be strikingly sensitive to utterance length. Of all the variance in spoken disfluencies in the present data, 79% was predictable simply by knowing an utterance's specific length. A linear model was provided, Y = -0.84 + 0.35 X, to summarize the predicted rate of spoken disfluencies ( Y) as a function of utterance length ( X). This finding replicates and generalizes the linear predictive model between utterance length and spoken disfluencies reported previously by Oviatt and colleagues [11,8], which was based on human-computer interaction involving verbal and quantitative content. In previous research, the best fitting linear model was a similar Y = -0.32 + 0.26 X, which accounted for 77% of the variance in observed spoken disfluencies. In a recent analysis of disfluencies in the Air Travel Information System (ATIS) domain that involved a different data collection procedure, Shriberg [13] replicated this finding that a linear model provides the best fit between disfluencies and utterance length during human-computer interaction. Both the present research on map displays and Shriberg's research on ATIS data confirm that knowledge of utterance length is a powerful and robust predictor of spoken disfluencies during human-computer interaction --- one with broad application to qualitatively different task domains and styles of query interaction. Although the increased planning demands of generating progressively longer utterances is an excellent predictor of disfluencies, nonetheless in the map domain utterance length per se is not necessarily the direct cause or the only factor driving heightened disfluencies, as indicated by the results on spatial location descriptions.
From a pragmatic viewpoint, interface techniques capable of guiding people's spoken input to avoid lengthy constructions (i.e., 13 words or more) could potentially reduce spoken disfluencies by a substantial 74%. Since lengthier utterances to the map frequently contained descriptions of spatial location, and since multimodal interaction typically circumvented location descriptions through pen-based pointing or marking, the most effective way to elicit brief input during map-based tasks appears to be selecting a multimodal interface design. Whether other complex visual-spatial domains involving graphic, photographic, or moving audio-visual images would benefit from similar performance advantages if implemented multimodally remains to be investigated.
With respect to relative efficiency, time required to complete map-based tasks actually was shorter during multimodal than speech-only input, primarily because location and shape can be designated more precisely, rapidly, and with less effort and error using the pen. Specifically, task completion time was 10% faster during combined pen/voice input, even though it included 13% writing. Perhaps the greatest speed advantage of multimodal input accrued from pen-based pointing and graphic marks to designate a point, line, or area on the map display, which then avoided the need to speak complex location descriptions. Multimodal input speed also can be attributed to the relative speed of forming many frequently occurring map-based pen gestures (e.g., ---> to request scrolling), symbols (e.g., $), and abbreviations (e.g., ``BA" for bathroom), especially when compared with speech input needed to achieve the same goal (e.g., drawing a circle to zoom on a house, versus saying ``Show me the house at the southwest corner of Nevada and Broad Streets"). Although speech typically is reported to be two- to three-fold faster than writing or typing during human-human communication tasks [3,9], in these map tasks speaking was only 32% faster than pen input. This constriction of the usual speed advantage of spoken over written input clearly occurred because of the frequent use of gestures, abbreviations, symbols, and digits in the map domain, rather than handwriting of full lexical expresssions as in formal text. Given the speed and other performance advantages of multimodal input revealed by this research, applications involving complex visual-spatial displays such as GIS systems appear to constitute an ideal domain for the development of early multimodal systems.
The degree of structure provided by a map's visual display also influenced spoken disfluencies and content errors substantially. The minimally structured map, which required speakers to self-structure and plan to a greater degree, precipitated a 43% higher rate of disfluencies and 31% higher rate of content errors than the highly structured display. Since this presentation format difference occurred in samples matched for length, it clearly exerted an influence on disfluencies independent of utterance length. These results on map format replicate and generalize the previous finding that degree of interface structure in verbal or quantitative tasks, defined as a form-based graphic versus unconstrained scratchpad, influences users' language and disfluency levels [8]. The majority of users, or 84%, also reported a preference for the more structured map display, which they said facilitated rapid orientation, provided better guidance, and required less effort to self-structure. Perhaps surprisingly, users did not appear to view flexible self-structuring of the map as an advantage, but rather as ``more burden on you." Future research is needed to investigate methods of permitting users to flexibly self-structure interfaces without simultaneously driving up their cognitive load and difficult-to-process sources of variability in their language --- since these goals currently appear to trade off, and therefore present a dilemna for interface designers. Research also should address what impact other dimensions of interface display may have on the processability of human language input.
The vast majority of users, or approximately 95%, reported preferring to interact with the map multimodally, another 5% were satisfied with pen-only map interaction, but no users reported a preference to speak to the map. This strong preference for multimodal map interaction was replicated in data indicating that 100% of users' interacted multimodally when observed during free choice. Although in verbal and quantitative domains, people also preferred multimodal over unimodal interaction, this preference clearly was most pronounced when manipulating complex visual-spatial displays. Self reports revealed that people preferred to use speech and writing for different and often complementary functions. For example, in most instances requiring specification of a location, users had a strong preference to interject pen use, thereby avoiding spoken location descriptions.
From a methodological point of view, there now is cumulative evidence from this study and previous research that disfluencies present a sensitive index of cognitive load during human-computer interaction [8]. That is, the spoken disfluency rate per 100 words provides a window on inferential and sentential planning demands within the normal working range, below the threshold for verbalizing stress or any specific difficulties with a task. As such, disfluency rates may present a valuable tool for evaluating the adequacy of future spoken language or multimodal interfaces in supporting human performance. Since multimodal interfaces are relatively complex, empirical assessment may be particularly valuable for proactively guiding their design. Without such guidance, multimodal/multimedia systems with too many input and output options, or that are poorly integrated, run a special risk of fragmenting user behavior and driving up cognitive load to unacceptable levels. This in turn risks increasing human performance errors and difficult sources of linguistic variability in human input, which can be expected to have a direct bearing on degradation of system robustness.
Among other things, the goals of designing multimodal rather than unimodal
systems typically include enhanced ease of use, transparency,
flexibility, and efficiency, as well as usability for more challenging applications,
under more adverse conditions, and by a broader spectrum of the population.
However, actually achieving these advantages will depend on basic empirical
research on a variety of fundamental issues, as well as the construction of
theoretical models that predict the performance advantages of spoken,
manual, and combined input modes for different types of tasks. One
implication of this research is that multimodal systems evidently can
permit sufficient flexibility for users to avoid many errors, and to
optimize speed through selection of a particular input mode or integrated
use of modes at appropriate points during an interaction. In some tasks
permitting multimodal input, it also appears that users are
able to effectively self-manage their own cognitive load. The present research has
elucidated one class of application domains likely to benefit from
multimodal system design--- that of complex visual displays involving maps.
It also has provided information about specific performance advantages than
can be anticipated for multimodal versus unimodal map-based systems.